Lakes, challenge, people and collaboration
My latest post falls a little more in to the category of 'and things', rather than that of 'analytics', but hopefully to will see the relevance as you read.
At the end of the summer, I spent my time supporting two open water swim events in the beautiful setting of the English Lake District. Or that was the plan! Below you can see a beautiful, calm and tranquil Ullswater, the night before.
In the role of safety Kayaker and open water Lifeguard, I planned to spend my Saturday and Sunday paddling two of the most beautiful lakes in the UK, Ullswater and Windermere. For those of you who have read some of my previous posts, you may be familiar with the journey along the Windermere One Way, for those new to my Blog, feel free to check out that post.
There are many aspects of these events which cross over in to my role within data and analytics projects; people, planning, collaboration, communication, patience, focus to mention a few.
Each of these events, the Ullswater Chill Swim (around 7 miles) and the Windermere One Way (around 11 miles), from the perspective of the swimmer and myself as a safety kayaker / lifeguard are quite different and require a varied approach.
Ullswater
Lets begin with the Chill Swim, a mass participation event with around 250 swimmers, groups of swimmers start at various time intervals, with between 20 and 60 swimmers in each wave. Now traditionally, as this is an 'end to end' event, a team of safety kayakers (around 6 - 8 paddlers) are assigned a wave and follow that wave through out their swim.
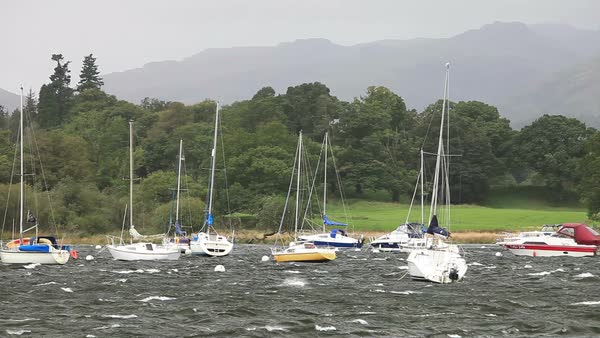
This year the weather had different ideas, with gusts of 35mph plus; for safety reasons, the decision was taken to restructure the event and create a 1 mile loop course at the East end of Ullswater where it was more sheltered.
You can see in the photo below (it doesn't do the conditions justice), the lake was no longer calm and tranquil but had transformed in to a 'seascape' with white topped waves (swelling at around 2ft).
So, in this scenario, the course is split in to 'zones' with kayak teams assigned a zone to cover. In order to prevent distraction and to keep the kayakers 'moving', each team rotates through the zones every 30 - 40 minutes.
So, where does this fit in with analytics? It's less the analytics and more the project comparisons, people and communication. Though we constantly have to analyse the situation and ajust approach and possition to ensure compatitors and support teams are safe. In this scenario the emphasis on communication is vital, after all, lives are at stake.
Planning!
As a kayak team, we need to communicate from the outset, before we even get our feet wet. Coordinating, roles and responsibilities, positioning within our zone, how we intent to communicate out on the water (it's difficult enough in calm conditions to communicate over 50 - 200 plus people out on the water, without 35mph gusting winds).


Comments
Post a Comment